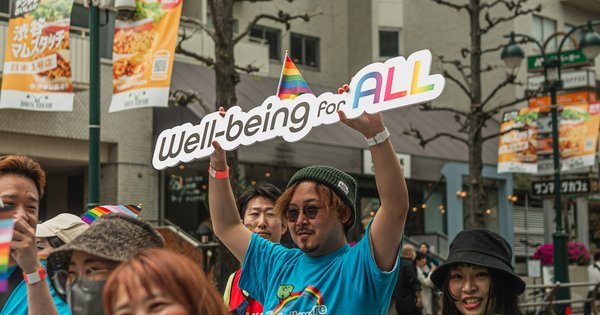
LGBTQ+ people now make up an estimated 12% of adults in the United States — roughly 26.5 million people, more than the entire population of Florida — according to a new analysis from the Human Rights Campaign (HRC) Foundation released this month. It’s the highest estimate of the US LGBTQ+ population to date, and it lands well above the figure most commonly cited in the media: Gallup’s 9%, published back in February.
The foundation, HRC’s educational and programmatic arm, built its estimate from 2.4 million entries in the US Census Bureau’s Household Pulse Survey, a self-reported federal data tool that captured sexual orientation and gender identity information from 2021 through 2024 — before the current administration began stripping those questions from federal surveys. Since January 2025, an estimated 360 federal data collections have dropped at least one SOGI measure, which makes this analysis something of a last look at what the government’s own numbers showed before that data started disappearing.
What the numbers actually show
Among all US adults, the foundation’s analysis breaks down to 2.34% transgender or gender-expansive, 3.27% lesbian or gay, and 7.08% bisexual. Within the LGBTQ+ population specifically, bisexual people make up the largest share at roughly 65%, followed by lesbian or gay people at about 30%, with 21% identifying as transgender or gender-expansive (a category that overlaps with sexual orientation, since some respondents identify as both straight and trans or gender-expansive).
The age skew is striking: 54% of LGBTQ+ adults are under 35, compared with just 22% of non-LGBTQ+ adults in that age range, and 32% of LGBTQ+ adults are between 18 and 24. The data also shows LGBTQ+ adults are somewhat more likely to be Hispanic — 18%, compared to 13% of non-LGBTQ+ adults — while representation among other racial groups sits at 4% to 7%.
Geographically, the foundation estimates that 40 states plus Washington, DC now have LGBTQ+ populations above 10%, including several states that get outsized attention as electoral battlegrounds: Arizona, Georgia, Michigan, New Hampshire, North Carolina, and Pennsylvania. The lowest concentrations were found in five Southern states, three Midwestern states, plus New Jersey and West Virginia.
Why this estimate is higher than Gallup’s
HRC’s 12% and Gallup’s 9% aren’t measuring different things so much as measuring the same thing differently. Gallup’s estimate comes from telephone interviews, a method that generally produces more conservative self-identification numbers because people are speaking directly to a live interviewer. The Census Bureau’s Household Pulse Survey, by contrast, is filled out privately online or on paper — a format researchers have long found encourages more honest disclosure on sensitive questions, including sexual orientation and gender identity.
“Removing LGBTQ+ people from federal data does not make communities disappear — it makes them harder to see, understand, and serve,” the HRC Foundation wrote in its report. Tari Hanneman, the foundation’s senior director of research and education, added that reliable data collection is essential to understanding who actually lives in the country and what communities need — which is precisely the infrastructure that’s now being dismantled at the federal level.
The stakes behind the number
It’s tempting to read a headline like “12% of Americans are LGBTQ+” as just a curiosity, but the timing matters. This analysis exists at all because it was built from federal data collected under a prior policy environment — and that data pipeline is now being shut off deliberately. Advocacy groups, health researchers, and local governments all rely on population estimates like this one to allocate resources, from HIV prevention funding to housing programs for LGBTQ+ youth experiencing homelessness. When the underlying surveys stop asking the question, those estimates get harder to produce and easier to dismiss.
For now, the HRC Foundation’s analysis stands as one of the more rigorous efforts to answer a question that’s becoming harder to answer by design: not just how many LGBTQ+ people live in the US, but where, and how that population is changing. The answer, at least as of the last window when the government was still asking, is that LGBTQ+ Americans are a larger and younger share of the population than most previous estimates suggested — and increasingly concentrated in exactly the states most likely to decide the next election.